Caucasus Investment Group · caucasusinvestmentgroup.com
Georgia's Middle Corridor: Who Captures the Value?
Testing the investment case behind Georgia's emergence as a trade and logistics gateway between Europe and Asia.
- 1The clearest opportunity is to earn more from existing assets and contracted customer relationships. New capacity must prove its return on capital.
- 2Georgian Railway generated GEL 10.9m after property, plant and equipment spending in 2025, before GEL 55.6m of cash interest: a residual of negative GEL 44.7m despite a 124% rise in net profit.
- 3Anaklia's phase-one capacity of at least 600,000 TEU equals 80.5% of Georgia's 2025 container volume; at 7% national growth, a 300,000 TEU Anaklia would need 28.7% of the 2030 market.
- 4The evidence supports a regional distribution thesis more than large-scale substitution of China–Europe ocean trade.
- 5London-listed TBC (1.40x June book) and Lion Finance (1.95x) offer accessible, diversified exposure, but neither discloses corridor-specific profit, so the corridor alone does not justify a valuation premium.
Investment view
CIG is selectively constructive on Georgia’s connectivity economy. The strongest near-term investment proposition lies in earning more from infrastructure and customer relationships that already exist, followed by carefully priced, contracted logistics property and services. The published evidence does not yet establish an attractive financial return on the full capital required for Anaklia. London-listed Georgian banking groups provide accessible exposure to the broader economy, with corridor activity an additional source of business rather than a sufficient standalone reason to own their shares.
The distinction is visible in Georgian Railway. Freight fell 3.0% in 2025, revenue declined 5.5% and adjusted EBITDA fell 12.9%, while net profit rose 124.0%. Financing and currency effects substantially altered the reported earnings outcome. Cash generated after property, plant and equipment spending was just GEL 10.9m, before GEL 55.6m of cash interest. The operating business, accounting profit and distributable cash tell different stories.1819
Anaklia requires the same discipline. The government now envisages a landlord model, with USD 700m of public investment and USD 1.1bn including private participation. Its initial container capacity of at least 600,000 TEU compares with 745,483 TEU handled nationally in 2025. The project can add strategic resilience and accommodate deeper-draught vessels while still producing an inadequate financial return if traffic is diverted from existing ports, tariffs compress or terminal utilisation builds slowly.52526
Our preferred underwriting sequence is therefore customer commitments, retained revenue, incremental operating profit, total capital and cash recovery. We would require contracted demand and a credible return on the investor’s own capital before backing new capacity. We would assess banking shares against sustainable returns on equity and country risk. Evidence that would strengthen the view includes recurring railway cash improvement, independently measured reductions in corridor delays, binding Anaklia terminal agreements and warehouse leases that support adequate returns without assuming rising rents.
Key findings
Cargo mix and commercial terms determine who earns more. Georgian port tonnage increased in 2025 while rail tonnage declined. The national container total grew 17.2%, but an extra container does not generate an identical fee at every stage. Origin, destination, handling requirements, empty repositioning and the contractual allocation of costs influence the retained economics.45
The investable opportunity is primarily regional. The World Bank’s 2023 modelling placed intercontinental traffic below 40% of corridor volumes in 2030. PMC Research’s September 2026 analysis also identifies regional trade as the main driver of Georgian corridor transit. This supports an opportunity in Central Asian distribution and export access; it does not establish that Georgia will capture a large share of China-Europe container trade.16
Railway capacity is only one constraint. Dividing 2025 freight by the newly stated 48m-tonne engineering capacity gives 27.6%. That ratio does not measure locomotive availability, commercial train paths, border performance or onward shipping capacity. A railway can have substantial theoretical headroom and still be unable to offer a reliable additional service.451
Public and private Anaklia returns must be assessed separately. The July 2026 landlord decision assigns core infrastructure and access to the state, with terminal investment envisaged from private operators. A terminal investor could earn an acceptable return while the overall port produces a low financial return on public capital. State ownership also leaves construction, maintenance and demand risks within the wider fiscal system.2526
Warehousing is a price-sensitive opportunity. At USD 6.30 monthly rent per sqm, 85% occupancy and 20% unrecovered operating costs, annual net operating income is USD 51.41 per sqm. A USD 700 all-in basis yields 7.3% before tax, financing and recurring capital expenditure. A 10% yield requires an all-in basis near USD 514. These are CIG sensitivities, not observed transaction yields.39
The listed banks already have substantial businesses to value. At the previous day’s closing prices, TBCG trades at 1.40x June book value and Lion Finance at 1.95x, using the NBG reference exchange rate. Their corridor-specific profits are undisclosed. An investor must underwrite the Georgian credit cycle alongside Uzbekistan for TBC and Armenia for Lion, rather than assigning a logistics premium to consolidated earnings.4243454647
Executive summary
Georgia’s Middle Corridor investment case rests on a sequence of commercial decisions. Shippers must choose the route, operators must provide a reliable service, businesses must retain sufficient revenue and investors must receive cash after funding the assets that make the service possible. Rising throughput helps only when those conditions hold. Our analysis finds an increasingly active logistics economy, genuine demand for better services and a large infrastructure programme whose eventual returns remain unevenly distributed.
The most useful starting point is the national cargo record. Georgian Railway carried 13.258m tonnes in 2025, compared with 14.773m in 2022. Seaports and terminals processed 16.638m tonnes and 745,483 TEU in 2025. These series overlap physically and cannot be added to produce unique Georgian cargo. They nevertheless demonstrate that different parts of the system can experience different demand conditions. Poti’s operator reported a further 9% increase in containers to 525,211 TEU in the first nine months of 2026.4532
The popular China-Europe framing understates the importance of regional commerce. Georgia also serves flows involving Azerbaijan, Central Asia, Armenia and Türkiye, alongside domestic imports and distribution. The available corridor datasets use different boundaries. We consequently reject a synthetic historical series assembled from incompatible tonnage definitions. A published growth rate is useful only when the same geography, cargo scope and accounting unit remain in the denominator.
Existing operators have the clearest opportunity to increase earnings without recreating their asset base. However, Georgian Railway illustrates the limits of that argument. Its 2025 cash capital expenditure exceeded 90% of operating cash flow. The sharp improvement in H1 2026 adjusted EBITDA also included a large fixed-asset disposal gain. Removing that gain and insurance income still leaves improvement, but substantially less than the headline increase. The investment case requires recurring cash generation and a credible refinancing plan for the USD 500m bond due in June 2028.182124
Anaklia is the largest test of capital discipline. Marine works are under way, and the contractor targets first-phase completion in 2029. Private terminal terms and the full financing structure were not verified at the cut-off. At a 7% national container growth assumption, Georgia’s market reaches approximately 1.05m TEU in 2030. A 300,000 TEU Anaklia would then take almost 29% of the national market. That could be commercially achievable, but the source of traffic and the response from incumbents determine whether the country gains new activity or redistributes existing business.2627
Value retention beyond transit is already visible in re-exports and warehouse financing. Revised Geostat data imply that re-exports accounted for 53.9% of 2025 merchandise exports. Yet re-export turnover is not domestic production, and the vehicle’s sale value is not Georgian income. The relevant gains are trading margins, logistics services, finance, wages and associated investment. FDI data similarly require restraint: transport and storage attracted USD 168.4m in 2025, or 8.9% of total FDI, while finance and insurance remained much larger.1240
CIG’s conclusion is specific. Prioritise businesses that can secure customers and convert additional activity into cash with limited incremental capital. Require pre-leasing, realistic development costs and downside liquidity for warehouses. Treat Anaklia terminal opportunities as individual concessions requiring full contractual underwriting. Use listed banking groups for diversified financial exposure only where their earnings quality, capital and valuation justify the investment independently of corridor enthusiasm.
1. The corridor has changed
The main route links China and Central Asia to Kazakhstan’s Caspian ports, crosses to Azerbaijan, continues through Georgia and then divides between Türkiye and Black Sea connections to Europe. Cargo may join or leave at intermediate points. A shipment of Kazakh agricultural products moving west, an Azerbaijani trade flow and a Chinese container reaching Europe can share infrastructure while representing different markets and competitive alternatives.1
Route schematic: China / Central Asia → Kazakhstan → Caspian crossing → Azerbaijan → Georgia → Türkiye and Europe, or Black Sea ports and Europe. This is a network of rail, sea and road services with multiple commercial interfaces.
Interest increased after Russia’s invasion of Ukraine because route concentration acquired a more explicit commercial cost. Sanctions compliance, insurance, customer procurement rules and the possibility of disruption entered transport decisions alongside freight rates. Central Asian exporters also gained a stronger incentive to diversify market access. The EU’s January 2024 forum assembled EUR 10bn of commitments for sustainable transport connectivity in Central Asia. That figure covers several contributors and projects; it is neither a Georgian funding allocation nor proof that the money has been disbursed.12
China seeks additional routing flexibility; Türkiye and Azerbaijan seek greater use of their transport assets. Georgia’s opportunity is to provide the western link and domestic services. These incentives can diverge over tariffs: a competitive through-rate may require an operator to surrender margin to secure the shipment.
Exhibit 1 One corridor, several competing economic propositions
| Route / service | Historical guide to time and cost | Commercial constraint |
|---|---|---|
| Middle Corridor | 18–23 days; USD 4,500–6,000 / 40ft | Rail-sea-rail interfaces; vessel and schedule risk |
| Northern via Russia | 12–18 days; USD 2,500–3,100 / 40ft | Sanctions, compliance and route concentration |
| Southern via Iran | 20–25 days; USD 4,000–5,500 / 40ft | Sanctions, insurance and border execution |
| Ocean China–Europe | No comparable current all-in quote verified | Scalable; rate and voyage length depend on routing |
| Armenia / Nakhchivan alternatives | No established comparable service quote | Future competition for Azerbaijan–Türkiye flows |
Source: TBC Capital, September 2025;3 CIG assessment. Ranges are historical estimates with unharmonised endpoints, not October 2026 quotes. Route: China / Central Asia → Kazakhstan → Caspian crossing → Azerbaijan → Georgia → Türkiye and Europe, or Black Sea ports and Europe.
At range midpoints, the Middle Corridor cost premium to the northern route is 87.5%; shippers need a reason to pay it.
Historical cost estimates show why geopolitical interest cannot replace commercial analysis. Using TBC Capital’s September 2025 ranges, the midpoint price for a 40-foot container was USD 5,250 on the Middle Corridor against USD 2,800 on the northern route. The calculated premium is 87.5%. Those are historical, imperfectly harmonised comparisons, rather than current bookable prices. They establish a hurdle: a shipper needs sufficient resilience, compliance or inventory benefit to pay the difference.3
Reliability can outweigh an advertised average transit time. A manufacturer planning production needs an arrival distribution, including the late tail, rather than the best recorded block-train journey. Caspian vessel availability, border clearance, missed connections and Black Sea departures can absorb the geographic advantage. Gauge and handling interfaces add operating complexity. For inventories with a high cost of disruption, a more expensive route can still be rational; low-value bulk cargo is generally less able to absorb a high transport premium.
Iran-linked routes provide another alternative but introduce their own sanctions, insurance and operational constraints. Prospective routes through Armenia and Nakhchivan could compete for Azerbaijan-Türkiye traffic. Their eventual effect depends on operating arrangements, customs treatment and commercial reliability. CIG assigns no current freight revenue to an unproven future service. The practical competitive advantage Georgia must build is a dependable, sensibly priced offer that customers repeat after emergency rerouting incentives weaken.
2. Follow the cargo
The national railway series provides a consistent starting point from 2018. Freight increased from 10.005m tonnes to 13.258m in 2025, a CIG-calculated CAGR of 4.1%. Growth accelerated into 2022 and then reversed. Total volume in 2025 was 10.3% below that peak, while transit rail freight declined 6.2% from 2024 to 7.617m tonnes. Transit represented 57.5% of all railway tonnes in 2025.4
Port activity followed a different path. National maritime container throughput increased from 483,635 TEU in 2020 to 745,483 in 2025, a CAGR of 9.0%. The path was volatile, including a drop to 401,249 TEU in 2021 and a rise to 693,976 in 2023. The 2025 increase was 17.2%. Port tonnage reached 16.638m, up 6.8%, with general cargo representing 47.7%, liquid bulk 31.0% and dry bulk 21.3% in the annual release.5
Exhibit 2 Cargo recovery is uneven across modes
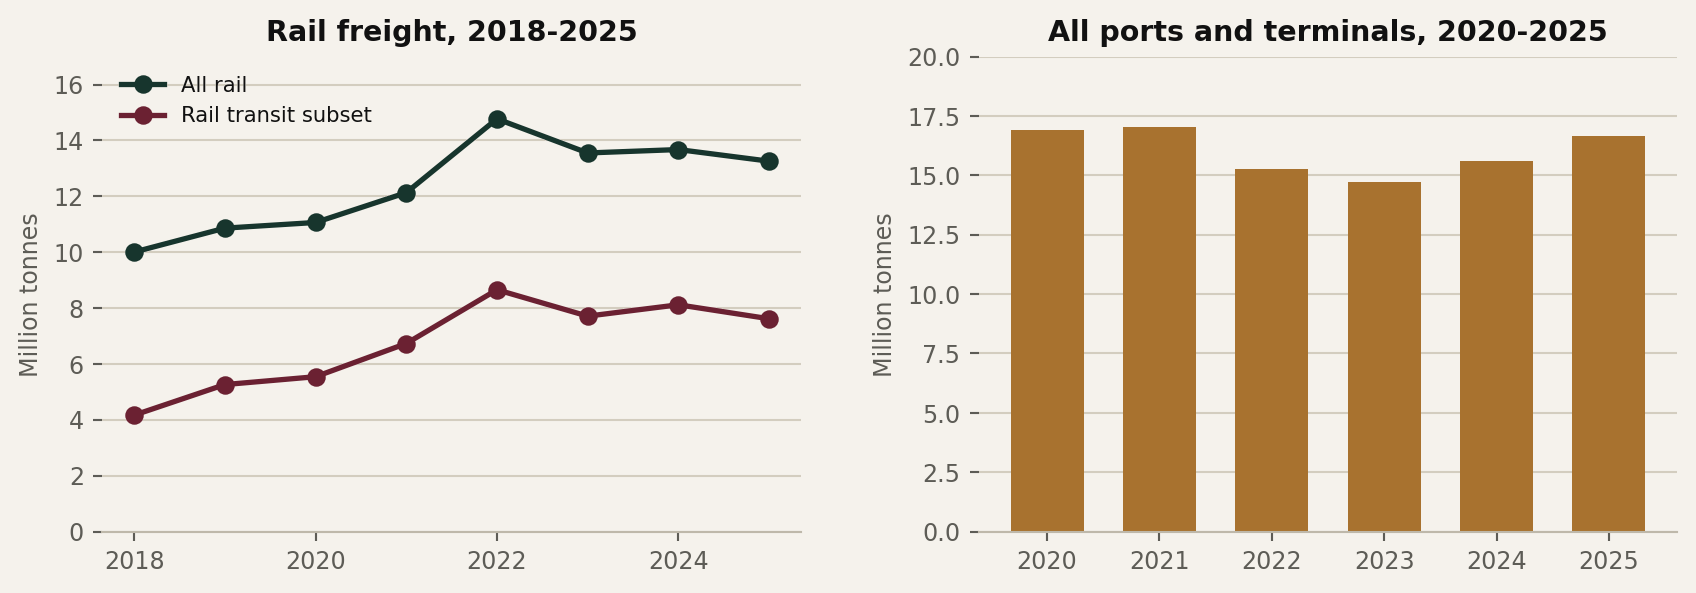
Source: Geostat;45 CIG calculations. National modal data overlap and must not be added.
2025 rail freight was 10.3% below 2022; port tonnage rose 6.8% in 2025, showing different cargo and route exposures.
Cargo composition, route choice and domestic demand explain different outcomes. Imports for Georgian or Armenian consumption generate different inland haulage, storage and customs work from through-shipments. National port growth cannot be assigned entirely to the Middle Corridor, or corridor growth entirely to China-Europe trade.
The latest official quarterly data show a recovery in 2026. Rail transported approximately 6.910m tonnes in H1, a calculated 10.3% increase against the corresponding 2025 source series. Ports and terminals processed approximately 9.681m tonnes and 409,639 TEU in H1. Separately, Poti’s operator reported 525,211 TEU in January-September, 9% more than a year earlier. These periods and reporting populations are deliberately kept separate.4532
Commodity exposure remains substantial. In Q2 2026, coke and refined petroleum represented 32.7% of rail freight, chemicals and related products 22.2%, and food, beverages and tobacco 13.7%. These categories accounted for 83.6% of transit tonnage. Such freight has different handling and pricing economics from manufactured-goods containers.57
Exhibit 3 The corridor denominator changes the answer
| Measure | Period / value | What it actually measures |
|---|---|---|
| National rail freight | 2025: 13.258m tonnes | All Georgian Railway cargo, including domestic |
| National rail transit | 2025: 7.617m tonnes | Transit subset of national rail freight |
| PMC total transit definition | 2025: 13.7m tonnes; 2024: 15.1m | PMC customs/route analysis; not all national freight |
| PMC Middle Corridor definition | 2025: 4.6m tonnes; 2022 peak: 5.0m | Georgian regional-trade corridor selection |
| TITR-associated containers | 2025: 76,900 TEU; +36% reported | Container units, not tonnes or China–EU only |
| ADY Express corridor containers | Jan–Aug 2026: 53,574 TEU; +10.9% | Operator-reported partial year; separate scope |
| National maritime containers | 2025: 745,483 TEU | All seaports and terminals; includes non-corridor trade |
Source: Geostat,45 PMC,6 TRACECA-hosted analysis,7 ADY Express statement via Report.az.8
No defensible single percentage expresses Georgia’s share of these incompatible volume series.
Definitions are particularly consequential for the corridor itself. PMC Research reports 4.6m tonnes of Georgian Middle Corridor flows in 2025, with a 5.0m peak in 2022. Its total transit measure was 13.7m tonnes, against 15.1m in 2024. TBC Capital’s earlier work used a different selection of transit demand. Neither can safely be combined with a national modal total or a narrow TITR tariff/service series to calculate Georgia’s share of the entire route.36
Container measures provide another perspective. A TRACECA-hosted analysis reports 76,900 TEU in 2025 and 36% annual growth. An identified ADY Express statement reports 53,574 TEU in January-August 2026 against 48,326 a year earlier, a calculated 10.9% increase. We retain the stated reporting scope and do not annualise the eight-month figure or convert TEU into tonnes using an assumed load factor.78
The evidence supports the regional-trade hypothesis, with qualifications. The World Bank’s demand model envisaged intercontinental trade below 40% of 2030 volumes, and PMC’s current origin-destination analysis also emphasises regional flows. Neither establishes an exact current China-Europe share. Some country flows are confidential, while intermediate trading locations can obscure origin. CIG’s judgement is that a regional logistics thesis is better supported than large-scale substitution from oceanic China-Europe trade. A complete shipment-level dataset could change that assessment.1657
3. Georgia’s infrastructure bet
The macroeconomic foundation
Georgia has grown rapidly, but the sources of that growth must be separated from corridor effects. The revised GDP series records average growth near 4.7% during 2015-2019, a 6.3% contraction in 2020 and double-digit recoveries in 2021 and 2022. Growth remained 9.7% in 2024 and approximately 7.5% in preliminary 2025 data, with nominal GDP of USD 38.1bn. Preliminary Q1 and Q2 2026 growth was 9.0% and 6.9%. Logistics serves this larger domestic economy alongside transit.910
Exhibit 4 Strong GDP growth has not produced a sustained rise in FDI intensity
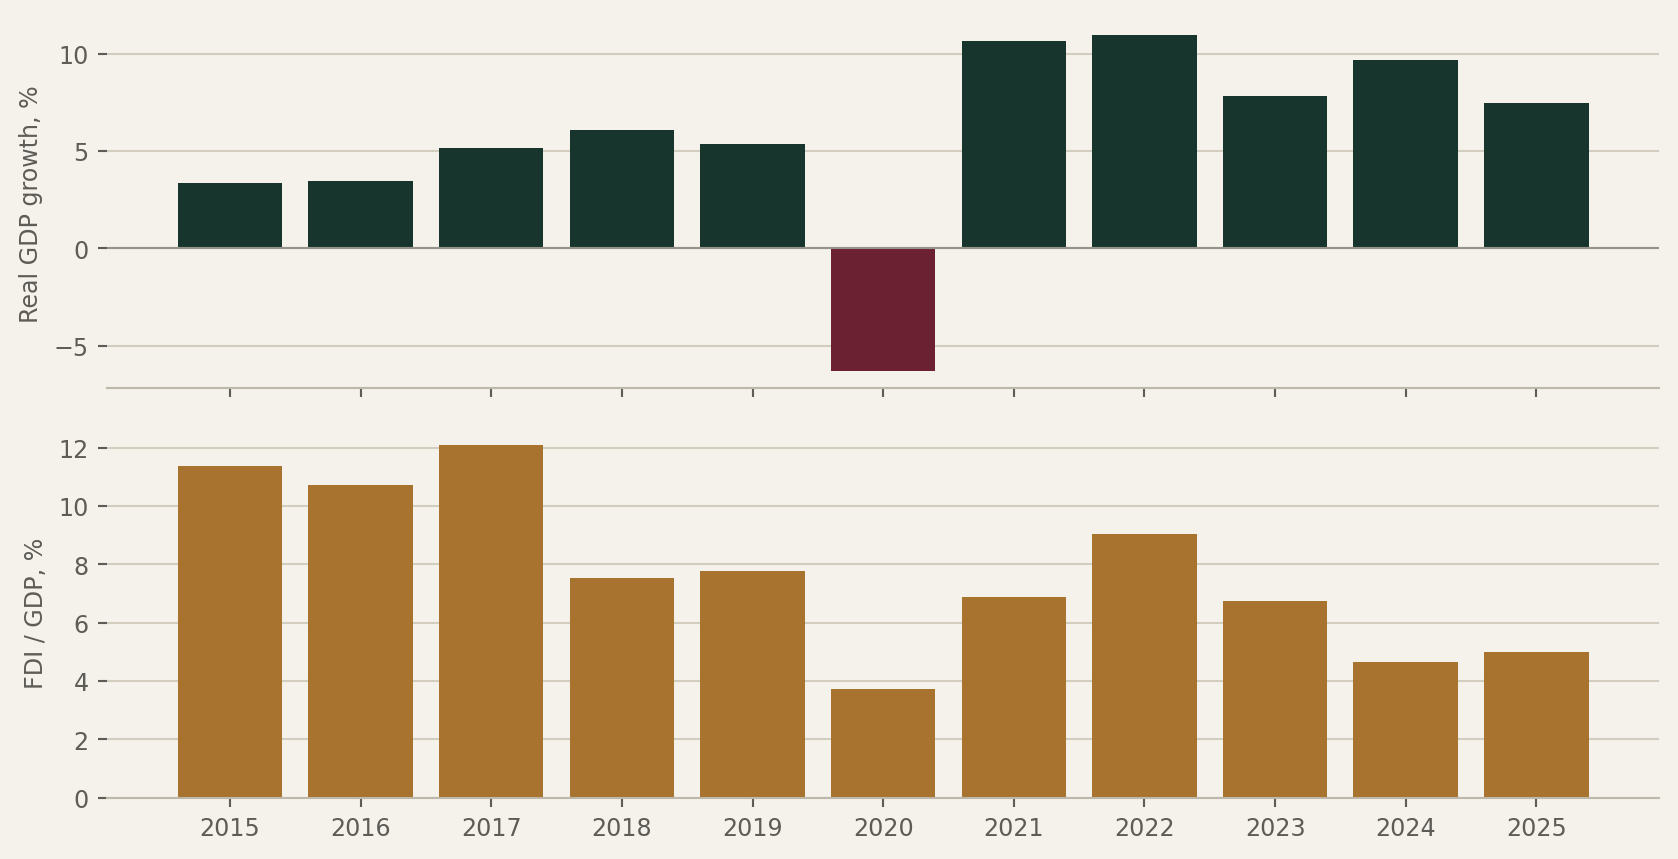
Source: Geostat;91011 CIG calculations. 2015–2025; 2025 GDP preliminary, FDI adjusted.
FDI was 5.0% of GDP in 2025, versus 11.4% in 2015; absolute investment growth overstates the change in intensity.
Post-pandemic recovery, tourism, migration-related inflows, domestic credit and consumption also affect trade, rents and bank earnings. The IMF’s June 2026 consultation projected growth moderating to 6.5% in 2026 and a medium-term rate around 5%. Those are explicitly dated forecasts. They do not identify the corridor’s incremental contribution to GDP. CIG does not treat every extra warehouse, bank loan or imported vehicle after 2022 as corridor-generated activity.13
Financing conditions influence who can capture growth. The latest NBG decision left its rate at 8.25%; September CPI inflation was 5.6%. End-September reserves were reported near USD 8.17bn. The IMF placed public debt below 35% of GDP in its consultation. Public infrastructure still competes for fiscal resources, while private local-currency borrowing can remain expensive.13141556
The domestic labour market presents a similar qualification. Unemployment was 13.9% in 2025 and 13.8% in Q2 2026, but the availability of trained engineers, customs specialists and warehouse managers cannot be inferred from aggregate unemployment. Geostat’s January 2026 population is 3.941m. Census changes affect comparisons with earlier population and per-capita measures. Productivity gains require more output per worker and per unit of capital; the construction of an asset alone does not demonstrate either.1617
Georgian Railway as an investment case study
Railway modernisation was inaugurated in December 2025. The stated engineering capacity rises from 27m to 48m tonnes, following a project costing approximately GEL 1bn. Rolling stock, train scheduling and connections remain separate constraints. The BTK line’s stated annual capacity is 5m tonnes following modernisation, while the entire East-West Highway remains a phased programme. A September 2026 official statement reported 75% highway completion and targeted the remaining links by 2030.515253
Exhibit 5 Georgian Railway: earnings, capital and cash conversion
| GEL million unless stated | 2023 | 2024 | 2025 |
|---|---|---|---|
| Revenue | 627.17 | 648.34 | 612.36 |
| Freight incl. handling | 429.27 | 449.69 | 443.86 |
| Logistics revenue | 132.21 | 129.53 | 100.55 |
| Passenger revenue | 41.22 | 36.67 | 32.42 |
| Other revenue incl. grants/rent | 24.48 | 32.44 | 35.53 |
| Adjusted EBITDA | 167.82 | 220.58 | 192.01 |
| Adjusted EBITDA margin (%) | 26.76 | 34.02 | 31.36 |
| Audited operating profit | 96.94 | 141.74 | 119.36 |
| Net profit | 86.78 | 68.18 | 152.73 |
| Operating cash flow | 176.81 | 218.83 | 192.25 |
| Cash PPE capex | 139.34 | 150.72 | 181.40 |
| OCF less PPE capex | 37.47 | 68.10 | 10.86 |
| Cash interest paid | 55.51 | 58.90 | 55.55 |
| Residual after capex/interest | −18.04 | 9.20 | −44.69 |
| Cash and equivalents | 283.55 | 318.30 | 266.25 |
| Borrowings | 1,376.14 | 1,425.68 | 1,358.59 |
| Net debt, cash-only deduction | 1,092.59 | 1,107.38 | 1,092.33 |
| Total equity | 868.04 | 936.32 | 1,089.61 |
| Pre-tax capital-return proxy (%) | 5.02 | 7.08 | 5.65 |
| Net debt / adjusted EBITDA (x) | 6.51 | 5.02 | 5.69 |
| Freight (million tonnes) | 13.55 | 13.67 | 13.26 |
| Freight turnover (bn tonne-km) | 3.84 | 3.95 | 3.81 |
| Freight revenue / tonne (GEL) | 31.68 | 32.89 | 33.48 |
| Adjusted EBITDA / tonne (GEL) | 12.38 | 16.13 | 14.48 |
| PPE capex / tonne (GEL) | 10.28 | 11.02 | 13.68 |
Source: Issuer consolidated reports;1819202122 Geostat;423 CIG calculations. Adjusted EBITDA is the issuer APM and includes associate results.
2025 generated GEL 10.9m after PPE spending, before cash interest; the residual after interest paid was negative GEL 44.7m.
The railway financial table uses consolidated figures and keeps operating profit distinct from management’s adjusted EBITDA. Freight revenue includes handling to preserve comparability with the earlier revenue note. Logistics revenue is presented separately, and other revenue includes grants, rentals and cross-border charges. The adjusted EBITDA measure includes results from equity-accounted investees, which should not be mistaken for cash received from them.18192022
The 2025 outcome challenges an uncomplicated operating-leverage narrative. Freight and handling revenue declined modestly, but logistics revenue fell from GEL 129.5m to GEL 100.5m. Total revenue declined to GEL 612.4m and adjusted EBITDA to GEL 192.0m. Audited operating profit was GEL 119.4m. Net finance moved from an expense of GEL 89.3m to income of GEL 22.0m, substantially explaining why net profit increased despite weaker operating earnings.18
Revenue quality also requires a distinction between tonnes and transport work. Freight turnover declined from 3.950bn tonne-km in 2024 to 3.815bn in 2025. Freight and handling revenue per tonne rose to approximately GEL 33.5 from GEL 32.9. That blended measure reflects distance, cargo mix, handling and currency as well as price; it is not a published tariff increase. Group adjusted EBITDA per tonne fell to GEL 14.5 while PPE capex per tonne rose to GEL 13.7.1823
Operating cash flow of GEL 192.3m barely covered cash PPE expenditure of GEL 181.4m. Subtracting interest paid produces a negative GEL 44.7m residual. This measure excludes interest receipts, asset sales, associate dividends and investment movements. It is a defined cash-conversion diagnostic, distinct from IFRS net cash movement.18
A simple pre-tax capital-return proxy divides operating profit by average equity plus cash-only net debt. It fell from 7.1% in 2024 to 5.6% in 2025. This is not a fully adjusted ROIC: non-operating assets, replacement cost and asset valuations require further adjustments. It nevertheless exposes the substantial capital behind the earnings.1819
H1 2026 improved, although headline EBITDA overstates the recurring change. Revenue rose 3.8% to GEL 306.8m and reported adjusted EBITDA reached GEL 140.6m. Other income included a GEL 39.6m gain on fixed-asset disposal and GEL 4.4m insurance income. Removing those items gives a CIG normalised sensitivity near GEL 96.6m, around 30% above the prior reported half-year EBITDA, with a margin near 31.5%. The gain is not cash from a repeat freight service, and this adjustment is CIG’s analytical measure rather than management guidance.2122
Exhibit 6 CIG railway volume sensitivity: corridor growth is diluted at group level
| Eligible volume growth | Incremental revenue | Incremental EBITDA | Group EBITDA | Net debt / EBITDA |
|---|---|---|---|---|
| 5% | 8.9 | 4.4 | 196.5 | 5.56x |
| 10% | 17.8 | 8.9 | 200.9 | 5.44x |
| 15% | 26.6 | 13.3 | 205.3 | 5.32x |
| 20% | 35.5 | 17.8 | 209.8 | 5.21x |
Source: GEL million. 2025 issuer baseline;18 CIG assumptions: 40% of freight/handling revenue eligible; constant yield and FX; 50% incremental EBITDA conversion; flat net debt.
Even 20% growth in the assumed eligible cargo pool raises group EBITDA by only 9.2%; this is a sensitivity, not guidance.
Our volume sensitivity applies corridor growth only to an assumed eligible portion of the business. Forty per cent of 2025 freight and handling revenue is exposed, with constant revenue yield and exchange rates. Half of incremental revenue converts to EBITDA. Under those assumptions, 20% eligible volume growth adds GEL 17.8m EBITDA, taking the group to GEL 209.8m. Flat net debt would still be approximately 5.21x that EBITDA. A 10% volume increase combined with a 5% yield reduction leaves eligible revenue only 4.5% higher, demonstrating how price concessions dilute volume leverage.
Investability is principally a credit question because the railway is state-owned. Its USD 500m, 4.00% bond matures on 17 June 2028. The prospectus contains debt-incurrence restrictions; a disclosed leverage ratio above an incurrence threshold is not automatically a maintenance-covenant breach. Refinancing cost, permitted debt, liquidity and the state’s capacity and willingness to support the issuer require independent credit work. The issuer’s displayed BB-/stable ratings are contextual information, rather than a substitute for that analysis.182422
4. Anaklia: strategic capacity, uncertain financial returns
Anaklia has moved through materially different contractual structures. The original development consortium was selected in 2016 and its agreement was cancelled in 2020. The subsequent ICC claim was dismissed in 2024; that outcome should not be generalised to every separate legal proceeding. Political controversy and disputes over financing accompanied the first attempt. For present underwriting, the lesson is the importance of enforceable responsibilities, financing milestones and termination provisions.30
The later procurement process shortlisted Terminal Investment Limited and a Chinese-Singaporean consortium involving China Communications Construction Company and China Harbour Investment. The Ministry of Finance’s 2025 programme records that only the latter submitted a proposal. That history does not establish that a Chinese investor currently owns a fixed share of the port. The July 2026 decision moved to a landlord model, replacing the earlier assumption of a single private development partner.2925
Exhibit 7 Anaklia: status must be assigned by delivery package
| Package / issue | Evidence at cut-off | Investment interpretation |
|---|---|---|
| Core ownership | Landlord model announced July 2026 | State retains marine/core infrastructure |
| Marine civil works | Contractor confirms dredging in August 2026 | Under construction; no operating cash flow |
| Access / depth | 17.5m design; 1,380m breakwater | Specifications and targets, not commissioned capacity |
| Private terminals | Private investment envisaged | Named binding operator terms not verified |
| Rail connection | Design complete; market study launched | End-October tender target; not an award |
| Programme capital | USD 700m state; USD 1.1bn total | Announced envelope; full financial close unverified |
| First commercial vessel | 2029 target | Forecast, not confirmed opening |
| Capacity | At least 600,000 TEU phase one | Dry-cargo capacity also announced; do not add TEU to tonnes |
Source: Ministry of Economy;252628 contractor;27 October statement.31
Public marine expenditure and terminal equity have different capital bases, cash flows and returns.
Construction evidence is stronger for the marine package than for the complete operating business. Jan De Nul confirmed dredging by two vessels in August 2026, an access-channel depth of 17.5m and a 1,380m breakwater to be built with Prime Concrete. The contractor targets dredging through end-2026, breakwater completion by end-2027 and the first phase by 2029. These are dated delivery targets. They do not establish acceptance, commissioning, terminal-equipment readiness or a booked first commercial vessel.27
The government’s September envelope is USD 700m of public capital and USD 1.1bn including private investment. It announces at least 600,000 TEU of initial container capacity and approximately 10m tonnes of dry-cargo handling capacity. The two units cannot be added, and the programme’s design basis is insufficiently detailed to establish whether those capacities can be achieved simultaneously. Nor does an expenditure envelope prove that binding debt and equity commitments cover every component.26
Access is another distinct project. An 18km railway connection has been envisaged. The 7 October update said railway design was complete and a market study had begun to enable an end-October construction tender. At this cut-off, the appropriate status is a planned procurement milestone. CIG has not treated an expected tender as an awarded contract or a completed connection.2831
The demand test begins with the existing market. Phase-one capacity equals 80.5% of Georgia’s 2025 national container throughput. At 50% utilisation, Anaklia would handle 300,000 TEU. With national demand growing 7% annually from 2025, total throughput reaches approximately 1.046m TEU in 2030, requiring Anaklia to take 28.7% share. Existing ports would retain roughly 746,000 TEU, almost exactly the national 2025 total. This scenario effectively assigns nearly all incremental demand to Anaklia while holding incumbents broadly flat.
Exhibit 8 Anaklia needs a national market-share transfer as well as new demand
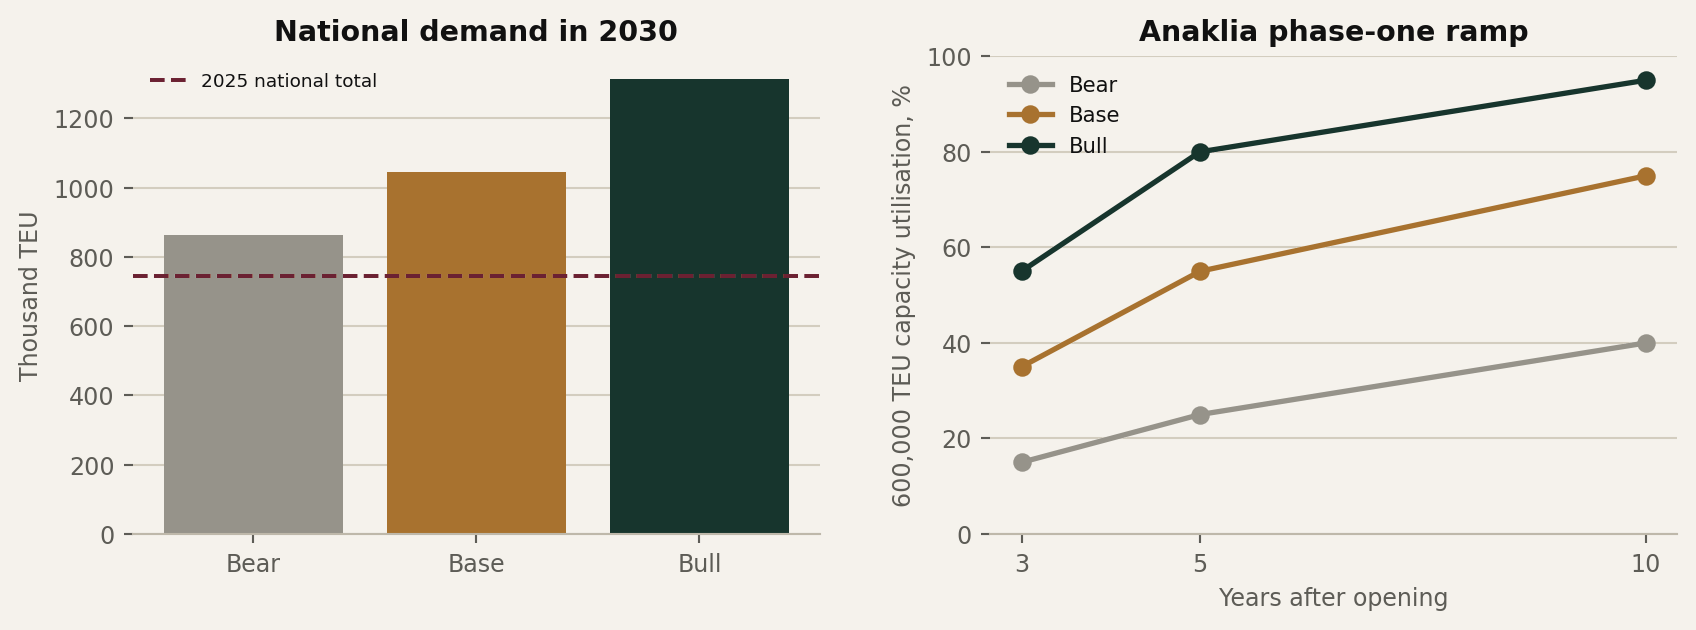
Source: Geostat 2025 container baseline;5 announced phase-one capacity;2627 all growth and ramp assumptions are CIG illustrations.
At 7% national growth, a 300,000 TEU Anaklia would require 28.7% share of the 2030 market; incumbent competition remains central.
At 3% national growth, the same 300,000 TEU requires a 34.7% market share and leaves incumbents materially below their starting volume. At 12%, the required share falls to 22.8%. Traffic could come from new regional trade, rerouting from other countries, domestic demand or transfers from Poti and Batumi. Only the first three expand Georgia’s addressable activity; a domestic port transfer mainly changes which operator earns existing fees.
For a longer ramp, CIG illustrates phase-one utilisation of 15%, 25% and 40% in the bear case at years three, five and ten after opening. The base case uses 35%, 55% and 75%, and the bull case 55%, 80% and 95%. Assuming a 2029 opening, those observations fall in 2031, 2033 and 2038. The denominator remains 600,000 TEU to isolate phase-one economics; it does not assume that later expansions are absent. The contractor’s separate ambition for at least 1m TEU by 2035 must be underwritten with its additional capital.27
A credible project NPV cannot be calculated from the disclosed inputs. Missing variables include terminal tariffs and discounts, the division of revenue between landlord and operator, concession duration, operating costs, maintenance dredging, phasing, taxes, financing and residual value. CIG therefore uses a capital-return hurdle. Ten per cent of USD 1.1bn requires USD 110m of annual cash generation before allowing for capital recovery. If containers alone supplied this amount, 300,000 TEU would need USD 367 of free cash flow each. Bulk and other income could contribute, but they also require assets and operating expenditure. This is a diagnostic, not a tariff forecast or project IRR.
Georgia can rationally choose to fund resilience, larger-vessel access and development options even when direct financial returns are modest. The private investor’s decision is narrower. A terminal could be attractive on its own smaller capital base if the state supplies marine infrastructure on favourable terms. That possibility requires the concession agreement and customer contracts. It cannot be inferred from the strategic importance of the port.
5. Who captures the value?
The accounting denominator must be explicit. USD 100 of cargo value is a poor basis for measuring logistics value capture because freight intensity differs sharply between commodities. CIG instead follows USD 100 of incremental customer spending on services supplied in Georgia. That is still an illustrative accounting framework. Public data do not establish a defensible allocation of an actual corridor invoice across every participant.
An operator first recognises revenue under its contract. It then pays workers, energy suppliers, maintenance providers and other service businesses. Interest, applicable taxes and owner distributions claim parts of the resulting cash flow. A forwarder may invoice an entire journey while retaining only a small service margin after buying transport from other operators. Adding that invoice to every underlying operator’s revenue overstates the economic activity created by the shipment.
Domestic value added, domestic ownership and domestic cash retention are also distinct. A foreign-owned terminal can pay Georgian wages, purchase local services and contribute domestic value added while distributing profits abroad. A Georgian-owned operator can spend heavily on imported equipment or foreign contractors. A domestically incorporated project financed overseas can retain operational activity while sending interest abroad. Ownership alone does not establish how much value remains in the country.
Exhibit 9 Following USD 100 of additional Georgian logistics customer spending
| Recipient / claim | Accounting and capital claim | Quality of return: CIG judgement |
|---|---|---|
| Port / railway / trucker | Service revenue; assets, labour, fuel and maintenance | Incumbent incremental use can be attractive; new-build return uncertain |
| Forwarder / warehouse | Retained service fee or rent; bought-in freight may be pass-through | Contracts and fee recognition more informative than gross billing |
| Workers / local suppliers | Wages and domestic purchases within operator costs | Local benefit depends on domestic sourcing and skill content |
| Lender / insurer | Interest or premium; capital, expected losses and funding costs | Selective underwriting can compound value; risk can dominate fees |
| Government | Applicable tax, concession rent, dividends less support obligations | Fiscal return differs from company EBITDA and social benefit |
| Foreign owner / supplier | Profits, interest, imported equipment or contractor payments | Can remove income from Georgia without eliminating local value added |
| Processing / manufacturing | Separate sale and production account | Requires a separate business case; not automatic transit spillover |
Source: CIG accounting framework, not measured allocations. USD 100 is an expenditure denominator, not cargo value or GDP. Ownership evidence.1825333637
Claims overlap: wages, interest, taxes and profits sit inside the same USD 100; adding them to operator revenue double-counts value.
In public accounts, transit and domestic imports have different fiscal treatment. Construction can increase near-term output while creating maintenance obligations. Taxes, concession rent and dividends should be compared with public capital and support commitments, rather than added to corporate EBITDA as separate national income.
Existing bottleneck assets may initially capture attractive incremental margins because their land, basic infrastructure and customer connections are already funded. Additional handling can spread fixed costs, while customer switching costs can support pricing. That advantage weakens if competition expands capacity faster than demand or if a through-rate agreement reallocates the margin elsewhere. Capital intensity must be assessed at the incremental decision being made, as well as across the whole business.
Services offer a different opportunity. A forwarder with repeat customers and efficient systems may scale without constructing a quay, but it can carry working-capital, credit and claims exposure. A warehouse with a sound lease can produce relatively predictable rent, yet its return depends on development cost and tenant quality. Banks can supply working capital and transactions while accepting credit and liquidity risk. Their apparently lower physical capital requirement does not remove their need for regulatory equity.
CIG ranks contracted service relationships and incremental use of existing assets ahead of uncontracted greenfield capacity on the current evidence. This is a ranking of underwriting visibility, not a claim that every forwarder earns more than every port. Publicly available private-company accounts and concession cash-flow detail are insufficient to prove a universal sector ROIC hierarchy. The superior investment is the claim purchased at an appropriate price with customer demand, cost exposure and exit rights understood.
Poti and Batumi: competition is already present
Poti is operated by APM Terminals within the Maersk group. Its operator describes 15 berths, 22km of rail track and direct links into the regional network. Exact 2025 container throughput was reported at 636,466 TEU. In October 2026, APM said a new mobile harbour crane scheduled for year-end would take container handling capacity above 650,000 TEU. A mechanically annualised nine-month run rate is about 700,000 TEU, indicating pressure, although seasonality prevents treating that as a forecast.323334
Batumi requires an ownership distinction. ICTSI’s wholly owned BICT operates its multipurpose container terminal under a 48-year lease begun in 2007. ICTSI’s expansion announcement reported capacity of 230,000 TEU, a historical nameplate figure rather than verified effective 2026 capacity. KazTransOil owns Batumi Oil Terminal and related port interests. Buying KazTransOil is therefore not equivalent to buying BICT, and neither provides a pure listed Georgian container-port investment.353637
The answer to whether Georgia needs Anaklia depends on the service specification. Existing ports can face container and vessel-access constraints while the national system still has spare capacity in other cargo categories. Poti’s planned equipment expansion also shows that some demand can be served incrementally. Anaklia represents a large bet on future demand and a different maritime offering. No current, comparable berth-by-berth draught and effective-capacity audit was verified for both incumbents, so CIG does not manufacture an aggregate port-utilisation percentage.
6. Beyond transit
Warehousing and industrial property
The warehouse opportunity is supported by demand for quality rather than a universal shortage of buildings. Galt & Taggart’s 2026 update, reported in Georgian media, places Tbilisi’s 2025 warehouse stock at 1.26m sqm, with more than 80% in lower-quality facilities. Reported rent reached USD 6.30 per sqm, and supply was projected to increase 31% by end-2027. These figures are credited to G&T; they are not a CIG property survey.39
TBC Capital’s research offers a complementary national view. It identifies substantial owner occupation, limited modern leased stock and approximately 85% occupancy in surveyed Tbilisi leasable warehouses. Its September 2025 rent ranges were USD 3-6 per sqm overall and USD 7-8 for Class A, excluding VAT and service charges. These are different populations from G&T’s city stock and rent observations. Comparing them as a single consistent time series would be misleading.3
Exhibit 10 Warehouse rents can look attractive before the capital bill
| Monthly rent / sqm | USD 500 / sqm cost | USD 700 / sqm cost | USD 900 / sqm cost |
|---|---|---|---|
| USD 5.00 | 8.2% | 5.8% | 4.5% |
| USD 6.30 | 10.3% | 7.3% | 5.7% |
| USD 7.50 | 12.2% | 8.7% | 6.8% |
Source: Rents anchored to the G&T update39 and TBC;3 all costs, 85% occupancy and 20% unrecovered cost assumptions are CIG, not market yield observations.
At USD 6.30 rent and USD 700 all-in cost per sqm, illustrative unlevered NOI yield is 7.3%, with a 13.6-year simple payback before tax and recurring capex.
Our sensitivity converts those rent observations into an underwriting question. Monthly rent multiplied by twelve, occupancy and the share retained after unrecovered operating costs gives annual NOI. At USD 6.30, 85% occupancy and 20% costs, NOI is USD 51.41 per sqm. Dividing by a hypothetical USD 700 all-in cost gives 7.3%. The resulting simple payback is 13.6 years, before taxes, financing, recurring capital expenditure and the time required to lease the building. At a 10% yield hurdle, the maximum all-in basis is approximately USD 514 per sqm.
Development-cost assumptions must include land, access, power, fit-out, professional fees, financing during construction and contingency. The model’s USD 500-900 range is a CIG stress range, not an observed Georgian construction-cost series. Cold storage cannot be valued by substituting a higher rent into the same cost structure: refrigeration, backup power, maintenance and tenant requirements change both capital and operating expenditure.
Demand growth also need not become third-party rental demand. G&T’s original survey found a marked preference among local companies for owning warehouses and retaining logistics in-house. TBC’s annual report provides a concrete financing example: ten warehouse developments totalling about 115,800 sqm financed in 2025, including support for GIANTI Logistics. This demonstrates business formation and banking activity; it does not establish an independently available high-yield property market.3844
The strongest opportunity is a facility matched to a named customer, with realistic indexation, currency matching and enforceable leases. A port-adjacent warehouse and a Tbilisi retail distribution centre serve different demand bases. Multi-tenant development diversifies customers while adding leasing and management costs.
Trade, distribution and industrial activity
Revised official data put 2025 goods exports at USD 7.288bn and domestic exports at USD 3.360bn. The difference, USD 3.928bn, represents re-exports, or 53.9% of the total. That is a material distribution business. It is also a warning against using headline export growth as a proxy for Georgian industrial output. The January-September 2026 express release records exports of USD 6.153bn and imports of USD 14.382bn; the detailed domestic/re-export split was not yet available for that same period.40
Exhibit 11 Distribution activity is visible; a corridor-led industrial boom is unproven
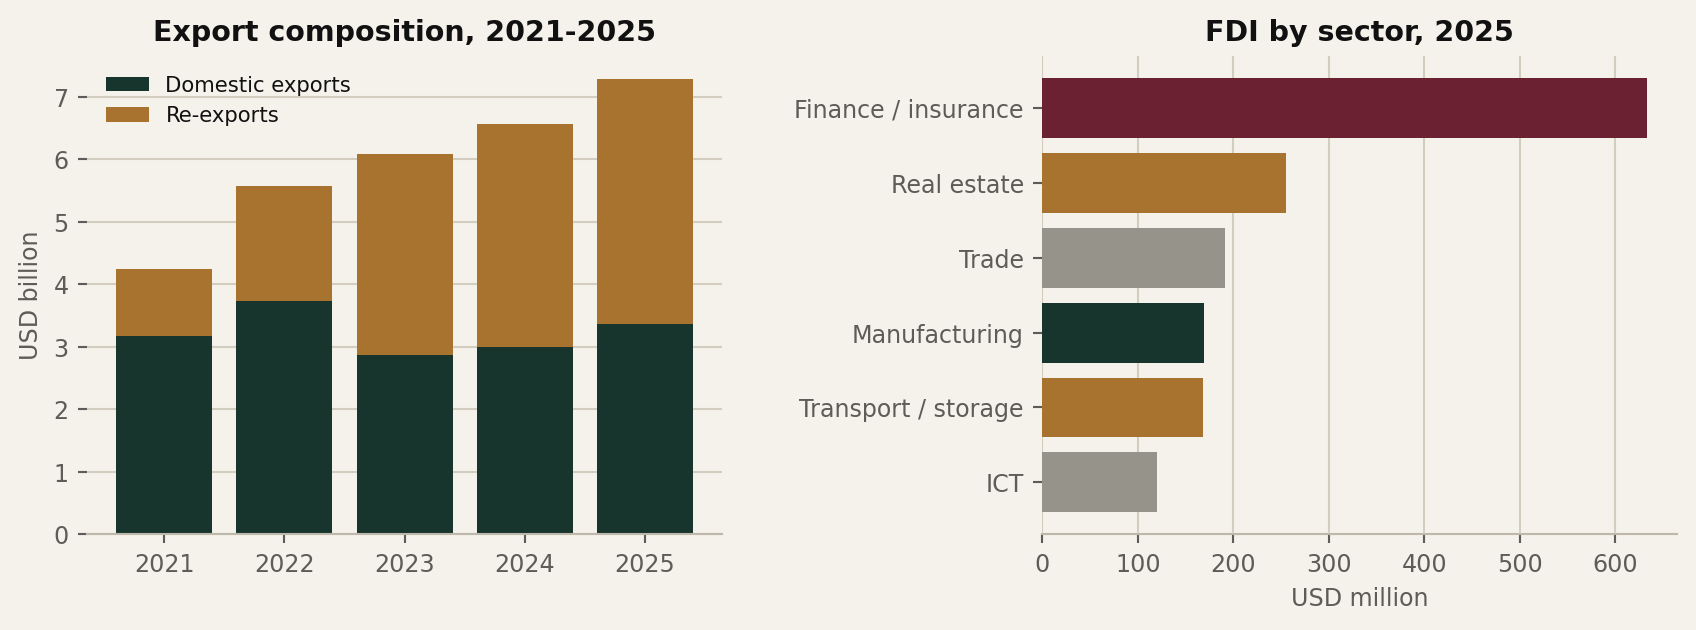
Source: Revised Geostat trade totals40 and adjusted FDI sector data;12 CIG re-export calculation.
Re-exports were 53.9% of 2025 goods exports, while transport and storage took 8.9% of FDI; neither measure establishes corridor causation.
Vehicle trading is particularly relevant. The preliminary 2025 trade release identifies cars as the largest export category, with Kyrgyzstan and Kazakhstan prominent export destinations. Türkiye, the US and China were major import sources, while Russia remained important in total trade. The current investment inference concerns a regional trading and distribution system, rather than a simple bilateral China-EU transport bridge. Partner and commodity detail here retains its preliminary-release label; revised aggregate trade totals are used elsewhere.41
The domestic income attached to a re-exported vehicle consists of the trading margin and associated preparation, transport, storage, finance and services, rather than the vehicle’s full sale price. Similar distinctions apply to machinery and consumer goods. Agricultural processing, packaging and cold-chain development may retain more domestic value, but they require export demand, standards compliance and commercially viable operations. Energy, metals and fertilisers can create large tonnage with very different fee and capital economics from containerised goods.
Manufacturing requires separate underwriting. Better transport can widen export markets and reduce inventories, while labour, energy and sourcing disadvantages can remain. Domestic export volumes, contracts, employment and operating margins must demonstrate an industrial spillover before it is capitalised into infrastructure valuations.
FDI: a financing signal with attribution limits
Adjusted FDI reached USD 1.900bn in 2025, 19.3% above 2024. Across 2015-2025, however, its nominal dollar CAGR was only about 1.0%. FDI intensity declined from 11.4% to 5.0% of GDP. The UK, Azerbaijan and Türkiye together supplied 44.4% of 2025 flows, based on the immediate-investor classification; that does not necessarily identify the ultimate owner’s nationality.11
Preliminary H1 2026 FDI was USD 750.1m, down 22.0% against the same 2025 period. Moreover, reinvested earnings represented 82.5% of adjusted 2025 FDI. Existing business profitability therefore explains much of the financing total; it should not be presented as equivalent new external cash for greenfield projects.1155
Finance and insurance attracted USD 633.2m, real estate USD 254.7m, trade USD 191.1m and transport/storage USD 168.4m. Sector totals can include reinvested earnings, acquisitions and other financing components. They are not interchangeable with fresh greenfield construction expenditure. Nor does a transport-sector classification prove that a project was caused by the Middle Corridor.12
Geostat’s enterprise survey records GEL 11.6bn of transport/storage turnover, GEL 4.9bn of value added and 77,300 employed in 2025. These establish domestic activity, with survey coverage distinct from national accounts and no attribution solely to the corridor.54
The announced Anaklia envelope, European connectivity commitments and realised Georgian FDI are therefore reported separately. A signed guarantee is a risk-sharing instrument, not a grant. AIIB’s Kazakhstan project, approved in March 2026, illustrates the distinction: its USD 564m partial guarantee accompanies up to USD 846m of IBRD guarantees for Kazakhstan rail connectivity. It supports the wider route without constituting a direct Georgian investment receipt.50
7. The listed equity angle
London-listed TBC Bank Group and Lion Finance Group provide the most straightforward publicly traded exposure among the Georgian businesses assessed here. Lion is the current parent name for Bank of Georgia and Ameriabank and retains ticker BGEO. TBC combines its Georgian franchise with a growing Uzbek financial ecosystem. Both are diversified regional banking investments, and their non-Georgian earnings can be more consequential to valuation than incremental Georgian corridor business.4243
New companies need accounts and payments; distributors use working capital, guarantees and FX; logistics operators may need equipment or property finance. These relationships generate interest, fees and deposits while requiring funding, underwriting and capital. Foreign development finance can also bypass local bank lending entirely.
Exhibit 12 Accessible bank exposure comes with regional and valuation risk
| Metric, H1 2026 unless noted | TBCG | BGEO |
|---|---|---|
| 14 Oct 2026 close (GBP) | 49.40 | 124.90 |
| Net profit (GEL m) | 750.9 | 1,203.8 |
| Reported annualised ROE / ROAE | 23.5% | 27.2% |
| Basic EPS, six months (GEL) | 13.50 | 28.24 |
| Book value / share, 30 June (GEL) | 121.46 | 220.69 |
| Price / book, CIG | 1.40x | 1.95x |
| Price / 2x H1 basic EPS, CIG | 6.30x | 7.61x |
| 2x H1 declared cash DPS / price | 4.1% | 2.7% |
| Main non-Georgian banking exposure | Uzbekistan | Armenia |
| Corridor-specific profit disclosed? | No | No |
Source: Issuer RNS;4243 prices;4647 NBG GEL 3.4415 / GBP;45 CIG calculations. Annualised half-year multiples and yields are not trailing, consensus or forecast measures.
The banks are investable businesses with corridor optionality; the corridor alone does not justify a valuation premium.
There is measurable exposure, but its current scale argues against exaggeration. TBC’s H1 disclosure places transportation loans at GEL 319.5m, approximately 1.05% of gross customer loans of GEL 30.457bn. Transportation customer balances were GEL 1.022bn, showing that the relationship includes funding and transactions as well as lending. These industry classifications are broader than corridor activity and do not disclose the related profit contribution.42
An illustrative materiality test is useful. Doubling that transportation loan balance would add approximately 1.05% to the same gross-loan denominator before repayments or changes elsewhere. At an assumed 3% annual post-funding, post-cost, post-loss contribution before tax, the added GEL 319.5m would produce only GEL 9.6m a year. That is below 1% of twice TBC’s H1 group profit. The assumed margin is CIG’s, and fee or deposit benefits could add to it. Even so, the scale demonstrates why a large sector percentage change can remain modest at group level.
The valuation table uses a common market date and a single official reference exchange rate. At GBP 49.40, TBCG is valued at approximately GEL 170.01 per share, or 1.40x June book and 6.30x twice H1 basic EPS. At GBP 124.90, BGEO is approximately GEL 429.84, or 1.95x book and 7.61x twice H1 basic EPS. Annualising six-month earnings is a transparent comparison convention, not a forecast or a trailing earnings multiple.4243454647
High observed ROE does not remove the need for an adequate required return. In a simplified steady-state model, justified price/book equals sustainable ROE less growth, divided by cost of equity less growth. Using 4% perpetual book growth and the reported H1 annualised returns as illustrative sustainable ROE, TBC’s observed multiple implies a cost of equity near 17.9%, and Lion’s near 15.9%. The exercise assumes clean-surplus accounting and stable distributions. It is a valuation sensitivity, not an estimate of the correct discount rate.
Lower normalised ROE, higher credit costs or greater country risk warrant a lower valuation even when freight grows. Buybacks can improve per-share outcomes but consume capital. The table annualises H1 cash dividends and excludes buybacks. Banks require earnings, equity and regulatory-capital analysis; industrial EBITDA and net debt are unsuitable valuation anchors.
Potential catalysts include clearer sector-level banking disclosure, profitable growth in Georgian corporate activity and stronger recurring distributions. Risks include foreign-currency borrowers, construction concentration, competition in payments and FX, regional acquisitions and regulatory capital requirements. CIG assigns neither a target price nor a formal recommendation: the report identifies accessible exposures and current valuation conditions without claiming a corridor-specific earnings forecast that issuers do not disclose.
8. Can investors actually access the opportunity?
An economic beneficiary and a purchasable investment are different objects. Georgian Railway’s operating equity is not publicly available through the bond. A warehouse demand trend does not supply a listed property vehicle with the same assets. Ownership of a global port group gives an investor exposure to its entire portfolio and capital allocation, with Georgian activity potentially too small to determine the outcome.
Exhibit 13 Matching instruments to the actual cash-flow claim
| Access route | What investor owns | Principal investment hurdle |
|---|---|---|
| TBCG / BGEO in London | Diversified banking earnings and capital distributions | Country, FX, credit and non-Georgian businesses; price discipline |
| Maersk / ICTSI / KazTransOil | Large parent groups with Georgian port interests | Georgia contribution may be too small to drive parent valuation |
| Georgian Railway Eurobond | USD contractual credit claim, not railway equity | 2028 refinancing, credit spread, covenants and dealing size |
| Georgian sovereign / local bonds | Fiscal or issuer credit claim | Currency, duration, liquidity, custody and credit risk |
| Private terminals / logistics businesses | Negotiated equity, concession or shareholder claim | Contract, customer, capital and enforceability due diligence |
| Warehouses / industrial property | Rent and residual property value | Tenant quality, all-in basis, vacancy, currency and exit |
| Development / project finance | Structured debt or equity with risk allocation | Bankability and debt-service coverage; strategic importance insufficient |
Source: Issuer and operator disclosures;24333637424344 CIG access assessment. No live executable bond quotations verified.
Public equities offer easier access; direct exposure generally requires private-market underwriting and negotiated terms.
The Maersk, ICTSI and KazTransOil routes have identifiable connections to Georgian maritime assets, but their valuation requires analysis far beyond Georgia. CIG has not treated them as pure corridor proxies or produced whole-group target prices based on an unquantified Georgian segment. The same discipline applies to potential future listings. No hypothetical railway or port IPO is included as a currently available investment route.333637
Local securities can offer a more direct credit claim, although the investor must confirm the instrument’s actual listing, custody, settlement, denomination and dealing terms. A published bond coupon is not its current yield. Price, accrued interest, maturity, credit risk and liquidity determine the return available at purchase. No verified executable Georgian Railway bond quote was obtained, so the report does not manufacture a current yield or spread from an old price.
Direct investment requires review of shareholder agreements, related-party contracts, concession duration, land title and exit rights. High EBITDA can coexist with weak minority-shareholder cash recovery. Control of distributions and responsibility for capital calls can dominate the apparent valuation.
Dollar rent does not protect a landlord when a GEL-earning tenant cannot pay after depreciation. Project debt-service coverage must withstand slower ramp-up and delays. Development finance may improve tenor and risk allocation without ensuring a commercial equity return. The investor must identify the exact contractual cash flow purchased.
9. What could break the thesis?
The central downside is capacity delivered ahead of durable demand. New terminals and rail assets can lower unit costs at full utilisation while generating poor returns during a prolonged ramp. Public financing can allow construction to continue even when private economics weaken. Investors must therefore monitor tariff realisation, contracted volumes and cash conversion alongside construction progress.
Exhibit 14 Risk mechanisms and evidence that would change the view
| Risk / CIG likelihood | Financial transmission | Mitigant / observable test |
|---|---|---|
| Execution / high | Delayed terminals or access defer revenue while capital costs accrue | Milestone completion, binding operator terms, liquidity contingency |
| Cargo diversion / medium-high | New capacity transfers incumbent business and compresses tariffs | Contracted new origin/destination cargo; yield and market-share disclosure |
| FX / medium-high | GEL cost base or debt mismatch; translated bank distributions fall | Currency-matched leases and borrowing, hedging and stress tests |
| Caspian / Black Sea disruption / medium-high | Missed sailings and higher inventory and insurance costs repel cargo | Vessel availability, buffer schedules and measured dwell-time variance |
| Political / EU / high, existing issue | Higher discount rates, constrained financing and investment delay | Documented improvement in institutions and EU relations |
| Regional conflict / uncertain, severe | Physical interruption, insurance exclusions, stranded capital | Diversification and insurance; exclusions checked explicitly |
| Credit / funding / medium-high | Low-margin growth plus impaired loans or refinancing erodes equity | Project DSCR, bank capital, NPL trends and maturity funding plan |
| Alternative routes / medium, long-term | Azerbaijan–Türkiye traffic bypasses Georgia; northern route regains flows | Customer retention and route cost and reliability comparison |
| Labour / governance / medium | Skill scarcity, related-party leakage and poor procurement reduce ROIC | Audited cash conversion, tender transparency and retention data |
Source: CIG qualitative assessment, not statistical probabilities; institutions;13484950 project evidence;25262728293031 issuer accounts.18192021222324
The investment loss occurs through cash flow, capital cost or exit value; aggregate cargo growth can coexist with all three deteriorating.
Political and institutional conditions directly affect discount rates and financing availability. The EU’s August 2026 assessment describes Georgia’s accession process as at a standstill and records restrictions on direct assistance following democratic backsliding. Continued trade arrangements should be assessed separately from the accession path. CIG does not assume a near-term accession-driven rerating or include uncommitted EU funding as a financing source.48
Russia-related risks extend beyond sanctions-driven rerouting. Conflict involving the occupied territories of Abkhazia and South Ossetia could affect confidence, insurance and physical operations. A return of traffic to a more competitive northern route could also weaken the volume base without any local asset failing operationally. Alternative southern Caucasus connections may compete particularly for east-west regional trade. The magnitude and timing are uncertain, so these risks are incorporated through demand and discount-rate sensitivities rather than artificial probability estimates.
Caspian and Black Sea disruption can interrupt service despite timely Georgian construction. Currency depreciation raises unhedged debt-service burdens and reduces translated bank distributions. Inflation can outpace tariff or lease indexation. Customer credit and freight prepayments can create liquidity stress before an accounting loss appears.
Governance determines how much of a successful operating outcome reaches investors. Procurement leakage, opaque related-party arrangements, weak concession enforcement or repeated support commitments can absorb returns. Regulation and safety improvements are constructive, including the railway agency’s reported work on oversight and public-service obligations, but implementation must be observed in audited outcomes and service quality.49
Evidence that would invalidate CIG’s selective constructive view would include sustained growth accompanied by falling retained revenue per shipment, persistently weak cash conversion after normal maintenance spending, warehouse lease terms that fail to cover capital costs, or bank credit losses exceeding the additional business generated. A completed port with insufficient contracted cargo would weaken the greenfield case even if national trade continued expanding.
10. Georgia 2030
CIG uses scenarios to expose the decisions that determine returns. The cases are conditional environments, not probability-weighted forecasts. Each starts from the same 2025 national container and rail baselines. GDP growth is an independent scenario input; it is not calculated from a transport multiplier or presented as an estimated corridor contribution.
Exhibit 15 Georgia 2030: three conditional investment environments
| CIG assumption / output | Bear | Base | Bull |
|---|---|---|---|
| National container CAGR, 2025–30 | 3% | 7% | 12% |
| National throughput (m TEU) | 0.86 | 1.05 | 1.31 |
| Illustrative rail CAGR, 2025–30 | −2% | 4% | 8% |
| Rail throughput (m tonnes) | 12.0 | 16.1 | 19.5 |
| Average real GDP growth, 2026–30 | 3% | 5% | 7% |
| 2030 GDP index, 2025 = 100 | 116 | 128 | 140 |
| Anaklia opening assumption | After 2030 | 2029; slow ramp | 2029; faster ramp |
| FDI underwriting test | Below 4% of GDP | 4–6% of GDP | Above 6%; broad-based |
| Likely investment result | Overcapacity and weak recovery | Selective service and property returns | Operating leverage plus industrial uptake |
Source: All forward figures are CIG scenarios, not forecasts or assigned probabilities. Baselines: Geostat;4591011 project target.2627
The base case supports selective investment, with no requirement that Georgia becomes a dominant China–Europe gateway.
The base case assumes 7% annual container growth and 4% rail growth through 2030, producing approximately 1.05m TEU and 16.1m rail tonnes. Georgia becomes a stronger regional gateway, with domestic demand and neighbouring markets supporting activity. Anaklia opens around the stated target but builds utilisation gradually. The investment outcome favours operators with existing infrastructure, customer relationships and capital discipline. It does not require an extraordinary increase in China-Europe market share.
The bull case requires effective connections, dependable sailings and commercially attractive contracts. At 12% container growth, national throughput reaches approximately 1.31m TEU in 2030. Distribution and industrial activity broaden the value pool, supported by higher FDI intensity. Excessive capital or tariff discounts could still prevent adequate shareholder returns.
The bear case allows containers to grow 3% annually while rail declines 2%. This is deliberately a case in which some headline activity still improves. Delays, diversion and weaker commercial terms can leave infrastructure poorly utilised and investors disappointed even without a collapse in trade. A later Anaklia opening reduces near-term operating revenue while construction and funding costs persist. Fiscal space, credit quality and exit liquidity become more important.
The near-term monitoring sequence is concrete. End-2026 marine-work and Poti crane targets should be checked against completion evidence. Anaklia’s expected railway procurement requires an actual tender, award and funding terms. The contractor’s end-2027 breakwater target and the railway’s June 2028 bond maturity precede the port’s 2029 operating target. These dates concern different obligations and should not be collapsed into one construction timetable.24273132
Annual railway accounts should reconcile recurring EBITDA with cash generation and new borrowing. Port releases should disclose cargo category and handling unit. Warehouse evidence should include completed space, leasing and achieved rent rather than permits alone. Bank results should show whether trade-related business improves earnings after funding and credit costs. Each release can either narrow the investment uncertainty or demonstrate that aggregate corridor enthusiasm has run ahead of cash returns.
Conclusion
Georgia can capture meaningful value from regional connectivity through operating services, trading relationships and productive investment around the transport network. The current evidence is strongest for a regional distribution economy and selective incremental opportunities. It is weaker for a broad claim that large new infrastructure automatically produces attractive financial returns.
CIG would favour incremental use of existing assets where retained revenue and maintenance needs are visible, and would consider warehouses or logistics businesses only at a capital basis supported by contracts and downside cash flow. Anaklia deserves close attention as a terminal-concession opportunity, subject to binding terms, customer commitments and a credible funding structure. The full public/private project cannot yet be assigned a defensible NPV from disclosed inputs. London-listed banks offer accessible, diversified exposure, with purchase decisions governed by sustainable ROE, capital and valuation.
The decisive investment evidence will be recurring cash after the capital bill. If Georgia’s operators can improve service reliability, retain customer margins and earn an adequate return on incremental assets, the corridor becomes a source of investable earnings. If capacity grows faster than contracted demand, economic activity can rise while shareholders and public capital receive disappointing returns.
Methodology
This publication uses information retrieved by 15 October 2026. Market comparisons use 14 October closing prices, converted at the NBG reference rate valid for that date. FY2025 is the latest complete railway year; H1 2026 is shown separately and identified as interim. Infrastructure announcements, construction evidence and operating status are distinguished throughout. Announced expenditure is not described as financially closed or realised FDI.
Primary sources are preferred: Geostat datasets, issuer accounts, government decisions, operator disclosures and the marine contractor’s update. TBC Capital and Galt & Taggart were reviewed for sector conventions, data definitions and analytical presentation. Their original research is credited explicitly. Identified secondary reporting supports exact Poti annual throughput, G&T’s July 2026 property update, the latest reserve release and certain official statements. Those exceptions are visible in the endnotes.
Rail freight is the Geostat gross goods series, including container tare; tonnage and tonne-km remain separate. Port throughput includes the national terminal population. Cargo handled at a port and subsequently transported by rail must not be counted twice as unique trade. The national maritime series begins in 2020 in the retrieved workbook. Earlier ministry figures use different boundaries and were not silently appended. No homogeneous, reconciled 2018-2026 whole-corridor tonnage dataset was verified; incompatible series and missing observations have not been interpolated.
Financial figures use consolidated accounts. Audited operating profit includes the reported ECL effect and may differ from a presentation headline labelled EBIT. Management adjusted EBITDA is retained as an alternative performance measure, including associate results. Net debt deducts cash and equivalents only from borrowings; term deposits and government securities are not silently treated as cash. OCF less PPE capex is shown before cash interest because the issuer classifies interest paid within financing. The further residual subtracts interest paid and excludes investment income, disposals and financing proceeds. Neither measure is represented as a management free-cash-flow forecast.
Original calculations are reproducible in the accompanying data file. CAGR is final value divided by initial value, raised to the reciprocal of elapsed years, less one. FDI/GDP uses dollar values for the same year. Re-exports equal exports less domestic exports. Railway sensitivity multiplies 2025 freight/handling revenue by an explicitly assumed eligible share, volume growth and incremental EBITDA conversion. Warehouse NOI equals monthly rent times twelve, occupancy and the retained operating share; yield divides this by assumed all-in cost. Anaklia scenarios compound the national container baseline and apply separate utilisation assumptions to 600,000 TEU phase-one capacity.
Bank P/B divides converted market price by reported June BVPS. The earnings multiple divides the same price by twice H1 basic EPS. Cash yield annualises H1 declared cash DPS and excludes buybacks. These are comparative sensitivities rather than trailing or consensus valuations. Scenario GDP, cargo and FDI conditions are CIG assumptions, with no probability assignments. The Anaklia cash hurdle is capital multiplied by a chosen annual return, not an IRR, DCF or estimate of social benefits.
Material evidence gaps remain in private terminal agreements, project financing terms, audited segment cash flows, effective port capacity, property transaction costs and corridor-level customer economics. These gaps limit precision and the ability to issue security-specific recommendations. They do not justify filling unavailable inputs with estimated facts. Figures may differ slightly because of rounding and subsequent statistical revisions.
-
World Bank, Middle Trade and Transport Corridor, November 2023. Demand modelling and route diagnosis; conditional projections, not realised volumes. Accessed 15 October 2026. ↩↩↩↩
-
European Commission, Trans-Caspian Investors Forum, 30 January 2024. EUR 10bn commitment covers Central Asia and multiple contributors; not a Georgian disbursement. Accessed 15 October 2026. ↩
-
TBC Capital, Logistics, 18 September 2025. Pages 7-12, 14-20. Original sector research credited to TBC Capital; historical route-cost estimates. Accessed 15 October 2026. ↩↩↩↩↩
-
Geostat, Goods Transported by Railway, updated 19 August 2026. Sheet 1, goods total and transit rows; thousand tonnes, including container tare. Accessed 15 October 2026. ↩↩↩↩↩↩↩↩↩
-
Geostat, Volume of Carried Freight in Ports and Terminals, updated 19 August 2026. 2020-2025 annual totals and Q1/Q2 2026; tonnes and TEU are different measures. Accessed 15 October 2026. ↩↩↩↩↩↩↩↩↩
-
PMC Research, Middle Corridor Transit Cargo Flows: Georgia, 8 September 2026. Published summary. Different scope from TITR or national modal totals; complete historical microdata not reproduced. Accessed 15 October 2026. ↩↩↩↩
-
TRACECA-hosted analysis by Levan Lomsadze, 7 April 2026. Reports 76,900 TEU and 36% growth in 2025. Its tonnage definition is not reconciled; do not splice series. Accessed 15 October 2026. ↩↩
-
Report.az, ADY Express COO statement, 9 September 2026. 53,574 TEU vs 48,326, January-August; secondary report of identified operator statement. Accessed 15 October 2026. ↩↩
-
Geostat, Real GDP Growth, updated 18 September 2026. GDP at market prices row; source indices minus 100. 2025 preliminary. Accessed 15 October 2026. ↩↩↩
-
Geostat, GDP at Current Prices, updated 18 September 2026. GDP, USD GDP, per-capita and average exchange-rate rows; 2025 preliminary. Accessed 15 October 2026. ↩↩↩
-
Geostat, FDI by Country, updated September 2026. Thousand USD converted to million; 2025 adjusted, 2026 H1 preliminary. Accessed 15 October 2026. ↩↩↩↩
-
Geostat, FDI by Economic Sector, updated 8 September 2026. 2025 adjusted; industry classification does not identify corridor-caused investment. Accessed 15 October 2026. ↩↩↩
-
IMF, 2026 Article IV consultation, 10 June 2026. Forecast vintage explicitly identified; fiscal/external framework, not latest monthly outcomes. Accessed 15 October 2026. ↩↩↩
-
National Bank of Georgia, policy decision, 9 September 2026. 8.25% policy rate; next meeting announced for 21 October 2026. Accessed 15 October 2026. ↩
-
Interfax, NBG reserve data, 12 October 2026. End-September reserves USD 8.17bn; secondary report of NBG release. Accessed 15 October 2026. ↩
-
Geostat, Employment and Unemployment, current data table. 2025 and Q2 2026 labour force survey figures. Accessed 15 October 2026. ↩
-
Geostat, Population, current data table. January 2026 population; census-related comparability warning applies to per-capita series. Accessed 15 October 2026. ↩
-
Georgian Railway, Annual Report 2025. Audited consolidated statements pp 269-277, management analysis pp 156-218. Downloaded from issuer; excludes separate-parent figures. Accessed 15 October 2026. ↩↩↩↩↩↩↩↩↩↩↩↩
-
Georgian Railway, Annual Report 2024. Consolidated income statement p 258, revenue note and 2023 comparatives. Audited operating profit includes ECL. Accessed 15 October 2026. ↩↩↩↩↩
-
Georgian Railway, Consolidated Financial Statements 2023. Consolidated balance sheet p 6, cash flow p 9; KPMG auditor report. Accessed 15 October 2026. ↩↩↩
-
Georgian Railway, H1 2026 interim financial statements. Unaudited. Cash flow p 7, notes 6-7. Disposal gains and insurance separately identified. Accessed 15 October 2026. ↩↩↩↩
-
Georgian Railway, Ratings and Performance Highlights. Adjusted EBITDA series and BB-/stable ratings as displayed by issuer; not a fresh agency rating action. Accessed 15 October 2026. ↩↩↩↩↩
-
Geostat, Railway Freight Turnover, updated 19 August 2026. Thousand tonne-km divided by 1 million gives billion tonne-km. Accessed 15 October 2026. ↩↩↩
-
Georgian Railway, Green Bond Prospectus, June 2021. USD 500m, 4.00%, maturity 17 June 2028; incurrence restrictions are not maintenance covenant tests. Accessed 15 October 2026. ↩↩↩↩↩
-
Ministry of Economy, landlord-port decision, 6 July 2026. State owns core infrastructure and access; private terminal investment. Supersedes prior single-partner assumption. Accessed 15 October 2026. ↩↩↩↩↩↩
-
Ministry of Economy, maritime forum statement, 7 September 2026. USD 700m state and USD 1.1bn total programme estimate; 600,000 TEU and c.10m tonnes dry cargo announced. Financing closure not established. Accessed 15 October 2026. ↩↩↩↩↩↩↩↩
-
Jan De Nul, Construction of New Deep-Sea Port Accelerates, 31 August 2026. Contractor confirmation of dredging, 17.5m access, 1,380m breakwater; 2027/2029 milestones are targets. Accessed 15 October 2026. ↩↩↩↩↩↩↩↩
-
Ministry of Economy, Anaklia site update, 6 May 2026. Marine works and planned 18km railway access; no claim that access is operational. Accessed 15 October 2026. ↩↩↩
-
Ministry of Finance, Economic Reform Programme 2025-2027. Historical procurement record, Chinese-Singaporean proposal and older USD 600m estimate, superseded in current model. Accessed 15 October 2026. ↩↩
-
Eurasianet, Anaklia arbitration report, 2024. Original consortium selected 2016, contract cancelled 2020; ICC claim dismissed. Separate proceedings not generalised. Accessed 15 October 2026. ↩↩
-
Imedi, Deputy Economy Minister on Anaklia, 7 October 2026. Market study to enable railway tender by end-October; not an awarded construction contract. Accessed 15 October 2026. ↩↩↩↩
-
APM Terminals Poti, nine-month results, 9 October 2026. 525,211 TEU, 336 calls; crane delivery target end-2026 and capacity above 650,000 TEU. Accessed 15 October 2026. ↩↩↩↩
-
APM Terminals, Our Port, current operator profile. Ownership/operator, 15 berths, 22km rail track; record 2025 volume above 600,000 TEU. Accessed 15 October 2026. ↩↩↩↩
-
PortNews, Poti 2025 results citing APM, 13 January 2026. 636,466 TEU vs 545,297 in 2024; secondary source used for exact annual total. Accessed 15 October 2026. ↩
-
ICTSI, BICT equipment and capacity announcement, October 2020. 230,000 TEU nameplate after expansion; historical, not audited effective 2026 capacity. Accessed 15 October 2026. ↩
-
ICTSI, Batumi terminal concession and expansion, February 2019. Wholly owned BICT; 48-year lease begun 2007. Separate from KazTransOil oil/port interests. Accessed 15 October 2026. ↩↩↩↩
-
KazTransOil, 2025 production results, 16 January 2026. Batumi Oil Terminal ownership and listed parent; no separate listed Batumi equity. Accessed 15 October 2026. ↩↩↩↩
-
Galt & Taggart, Warehouse and Logistics in Tbilisi, April 2025. Original 2024 market survey, in-house ownership and limited outsourcing. Superseded size/rent data not presented as current. Accessed 15 October 2026. ↩
-
GBC, Galt & Taggart warehouse research update, July 2026. Secondary Georgian-language summary: 2025 Tbilisi 1.26m sqm, USD 6.3/sqm rent, 31% supply growth to end-2027. Credited to G&T. Accessed 15 October 2026. ↩↩↩
-
Geostat, External Merchandise Trade, current tables. Revised 2025 exports/imports/domestic exports and January-September 2026 express release. Accessed 15 October 2026. ↩↩↩
-
Geostat, External Merchandise Trade 2025, 20 January 2026. Preliminary partner/commodity detail only; aggregate totals replaced by revised table [40]. Accessed 15 October 2026. ↩
-
TBC Bank Group, H1 2026 results, 6 August 2026. Issuer RNS, including EPS, BVPS, loan-sector and deposit concentrations. Banks assessed using earnings and capital, not EBITDA. Accessed 15 October 2026. ↩↩↩↩↩↩
-
Lion Finance Group, H1 2026 results, 11 August 2026. Issuer RNS. Parent of Bank of Georgia and Ameriabank; BGEO ticker retained. Accessed 15 October 2026. ↩↩↩↩↩
-
TBC Bank Group, Annual Report 2025. Warehouse financing example and longer-term financial history; management claims identified. Accessed 15 October 2026. ↩↩
-
National Bank of Georgia, official exchange rates for 14 October 2026. GBP 1 = GEL 3.4415; reference rate, not an executable exchange quote. Accessed 15 October 2026. ↩↩↩
-
Investors Chronicle market data, TBCG historical price. 14 October 2026 close 4,940 GBX; delayed data. Cross-checked with Investing.com historical table. Accessed 15 October 2026. ↩↩↩
-
Stock Analysis, Lion Finance historical price. 14 October 2026 close 12,490 GBX; delayed data, not a live execution quote. Accessed 15 October 2026. ↩↩↩
-
European External Action Service, EU and Georgia, 7 August 2026. Accession standstill and assistance restrictions; separate from continued DCFTA framework. Accessed 15 October 2026. ↩↩
-
Rail Transport Agency of Georgia, railway reform review, 2026. PSO model, safety and sector oversight; reform implementation is not a revenue guarantee. Accessed 15 October 2026. ↩↩
-
AIIB, Kazakhstan Middle Corridor Phase I, approved 25 March 2026. USD 564m partial guarantee alongside up to USD 846m IBRD guarantee; not grants or Georgian FDI. Accessed 15 October 2026. ↩↩
-
1TV, railway modernisation completion, December 2025. GEL 1bn project; engineering throughput 27m to 48m tonnes, distinct from rolling-stock constraints. Accessed 15 October 2026. ↩↩
-
Report.az, ADY/Georgian Railway BTK statement, July 2025. 5m tonnes capacity following modernisation; throughput not equated to design capacity. Accessed 15 October 2026. ↩
-
Trend, Deputy Economy Minister on highway status, 25 September 2026. Reported 75% completion, full East-West Highway target 2030; identified official speech. Accessed 15 October 2026. ↩
-
Geostat, Transportation and Storage enterprise statistics. 2025 turnover, value added, fixed assets and employment. Enterprise survey boundaries differ from national accounts. Accessed 15 October 2026. ↩
-
Geostat, FDI by Components, September 2026 update. 2025 reinvestment of earnings USD 1,567.5m; equity USD 685.7m; debt instruments negative USD 352.9m; adjusted data. Accessed 15 October 2026. ↩
-
Geostat, Inflation Rate in Georgia, September 2026, 2 October 2026. Latest September consumer-price release at the research cut-off. Accessed 15 October 2026. ↩
-
Geostat, Main Indicators of Railway, Q2 2026, 19 August 2026. Cargo composition and confidentiality of some origin/destination flows; period-specific percentages. Accessed 15 October 2026. ↩↩
No formal security rating or target price is issued. This publication does not state the personal holdings of CIG participants.
Sources
- Geostat · Railway, ports, GDP, FDI, trade and labour datasets, 2026 releases
- Ministry of Economy and Sustainable Development of Georgia · Anaklia landlord-port decision and programme statements, 2026
- National Bank of Georgia · Monetary policy decision, 9 September 2026; official exchange rates
- World Bank · Middle Trade and Transport Corridor, November 2023
- International Monetary Fund · Georgia 2026 Article IV consultation, 10 June 2026
- Georgian Railway · Annual Reports 2024 and 2025; H1 2026 interim statements; 2021 green bond prospectus
- TBC Bank Group and Lion Finance Group · H1 2026 results announcements
- APM Terminals Poti · Nine-month results, 9 October 2026
- TBC Capital · Logistics, 18 September 2025 (credited)
- Galt & Taggart · Warehouse and Logistics in Tbilisi, April 2025 (credited)
- PMC Research · Middle Corridor Transit Cargo Flows: Georgia, 8 September 2026
William Shalva Maisashvili (2026). Georgia's Middle Corridor: Who Captures the Value?. Caucasus Investment Group, 15 October 2026. https://caucasusinvestmentgroup.com/research/georgia-middle-corridor/
This publication is independent research provided for information only. It is not investment advice, a recommendation or an offer to buy or sell any security. See the research disclaimer.